Understand
Normal blood sugar levels
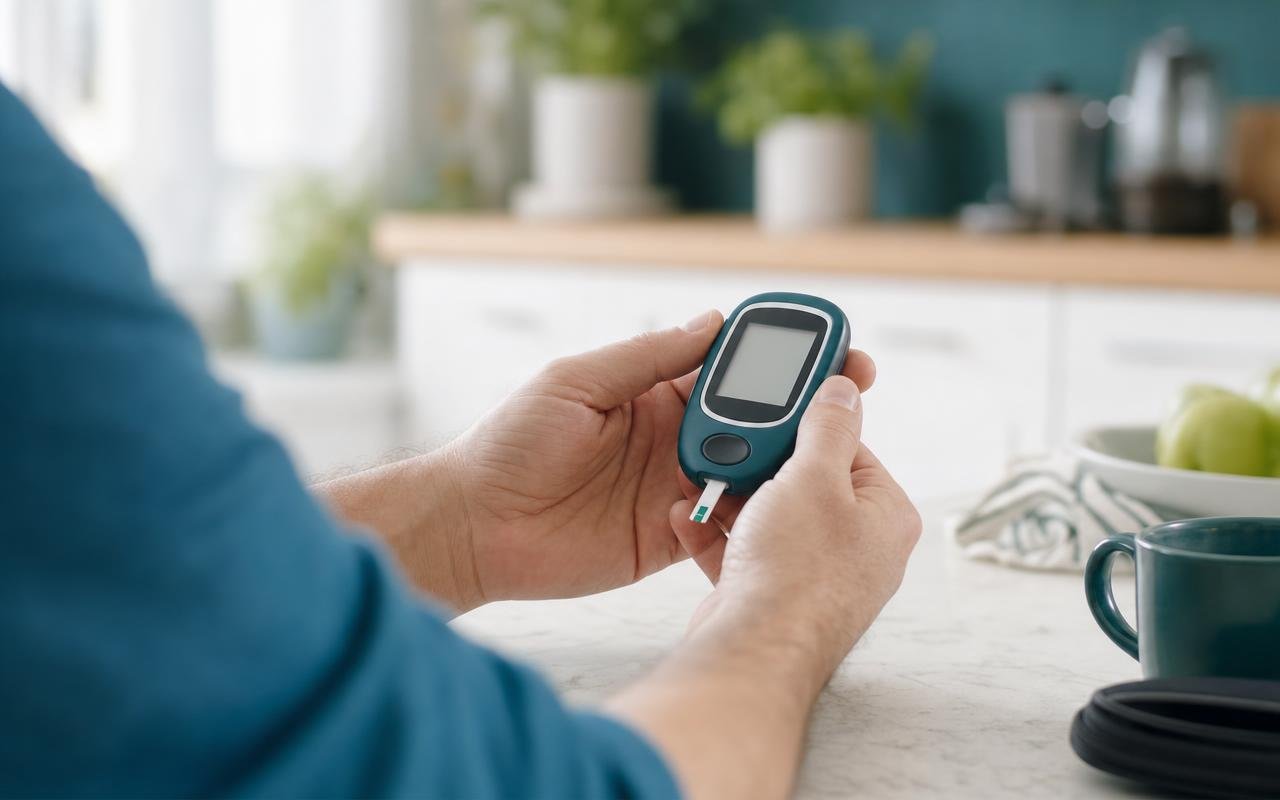
For most adults without diabetes, blood sugar runs 70–99 mg/dl (3.9–5.5 mmol/L) fasting, stays below 140 mg/dl two hours after a meal, and averages out to an A1C below 5.7 %. This page holds the full ADA classification chart — and, just as important, why the same number can be normal in one situation and not in another.
The ADA classification chart
| Category | Fasting (mg/dl) | 2 h after a meal (mg/dl) | A1C (%) |
|---|---|---|---|
| Severely low | below 54, any time | — | |
| Low (hypoglycemia) | 54–69, any time | — | |
| Normal | 70–99 | below 140 | below 5.7 |
| Prediabetes | 100–125 | 140–199 | 5.7–6.4 |
| Diabetes range | 126 and above | 200 and above | 6.5 and above |
Working in mmol/L? Divide the mg/dl value by 18 — so 99 mg/dl is 5.5 mmol/L, 126 is 7.0, 200 is 11.1. More on the two units in mg/dL vs mmol/L.
One rule sits above the whole chart: a diagnosis is never made from a single number. It takes a lab test, confirmed on a second occasion — a home meter, with its allowed ±15 % error, can flag a problem but never settle one.
Fasting readings
Fasting means at least 8 hours without food — in practice, the first measurement of the morning. It is the reference measurement because it removes the biggest variable, the last meal, and shows how well the body holds glucose steady on its own. Normal is 70–99 mg/dl; 100 mg/dl is where the prediabetes range starts, and 126 mg/dl is the diabetes threshold. The fasting blood sugar article covers how to take the test correctly and why mornings can run unexpectedly high.
Readings after meals
Every meal raises blood sugar — that is the system working, not failing. In people without diabetes the peak arrives roughly 60–90 minutes after eating and rarely clears 140 mg/dl; two hours after the start of the meal, the level should be back below 140. The diagnostic clock always starts with the first bite, not the last. Between 140 and 199 at the two-hour mark is prediabetes territory; 200 mg/dl and above is the diabetes range. The full post-meal curve is covered in blood sugar after eating.
A1C and random readings
A1C measures the share of hemoglobin with glucose attached and reflects the average over roughly three months — no fasting required, no single bad morning able to skew it. Below 5.7 % is normal, 5.7–6.4 is prediabetes, 6.5 and above is the diabetes range. It answers a different question than a meter does: the meter shows this moment, A1C shows the trend. How the two fit together is the subject of A1C and blood sugar.
A random reading — taken at an unknown time relative to food — is the hardest to classify. Only one line is conclusive: 200 mg/dl or above, together with symptoms like thirst, frequent urination and fatigue, is itself a diagnostic criterion. A random 130, on the other hand, means almost nothing without knowing when you last ate.
Why context changes what a number means
Take 130 mg/dl. Two hours after a pasta dinner, it is normal. Fasting, it is in the diabetes range. Same number, opposite meanings — which is why every reading needs two labels: the value and the timing. The bands in the chart are not stricter or looser versions of each other; they describe different physiological situations. Age and sex, for what it is worth, do not change these thresholds. Pregnancy does — gestational diabetes uses its own, stricter cut-offs, and those readings belong with an obstetric care team, not this chart.
Common reasons a reading misleads
- Measuring too soon after eating. A reading 30–60 minutes after a meal catches the peak, which has no defined "normal". The two-hour mark is where the bands apply.
- Unwashed hands. A trace of fruit, soda or hand cream on the fingertip can add 50 mg/dl or more. Wash with plain water, dry, re-test.
- Not actually fasting. Coffee with milk, a "small" bite, a sugary medication — the 8 hours start over. Plain water is fine.
- Meter error. ±15 % is within spec, so a true 100 can display as 88 or 113. Single borderline readings deserve a re-test, not a conclusion.
- Stress and illness. Infection, poor sleep and acute stress all raise glucose — a reading taken with the flu says little about your baseline.
The details that keep home measurements honest are collected in how to test blood sugar at home.
What to do with your number
Note the value, the timing (fasting or hours since eating), and anything unusual — the journal on this site keeps that on your device. One reading in the normal bands with no symptoms needs nothing further. Readings that repeatedly land in the prediabetes bands are worth a lab test and a look at what a prediabetes result means — it is the one stage where the trend reliably responds to change. Any fasting reading at 126 or above, or a two-hour reading at 200 or above, is a reason to see a doctor for a proper lab test. And below 70 or above 250, leave the chart aside — those situations have their own pages: low blood sugar and dangerously high blood sugar.
Sources
- Standards of Care in Diabetes — 2026 — American Diabetes Association
- Diabetes — Fact sheet — World Health Organization
- About Diabetes — Testing — Centers for Disease Control and Prevention
Educational information, not medical advice.